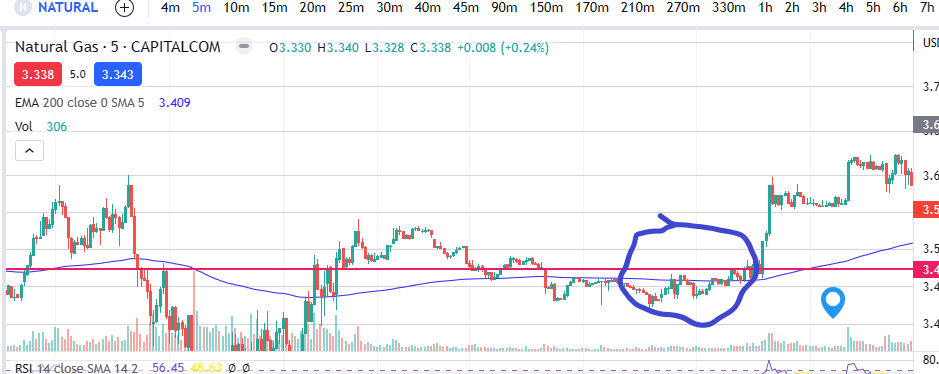
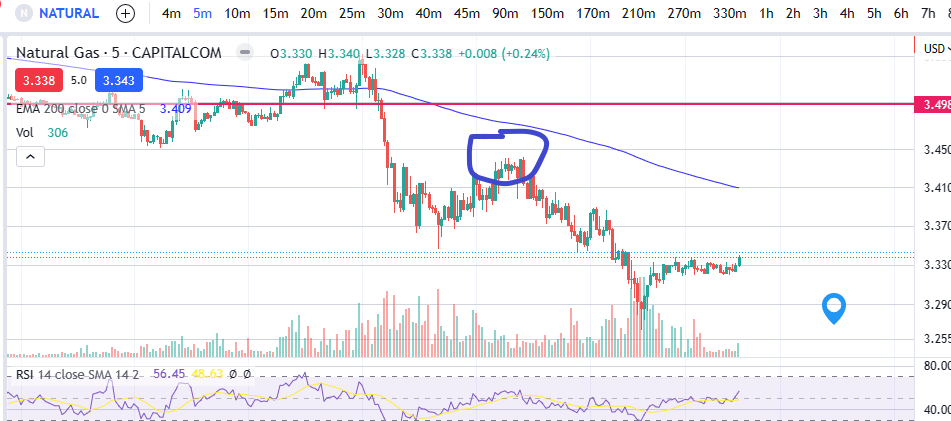
As well as providing a general and succinct set of data about the price at a given interval (see our Japanese Candlesticks Introduction page: Japanese Candlesticks – an introduction – Trader Pro (trader-pro.co.uk)), Japanese candles can also be used in conjunction with other indicators to identify good times to enter or exit trades. The first we consider are tweezer tops and bottoms. As the name suggests, Japanese candlesticks – tweezer patterns look a lot like pairs of tweezers either facing upwards or downwards. These are explained below with some examples on the chart together with what they are likely to mean/what they can predict is going to happen next.
Tweezer bottoms
Tweezer bottoms appear on the chart as identified in the screen shot below. They can appear at the end of a down trend and signify a possible change in direction. On a practical level, they represent a struggle between the bulls and bears where the price was pushed all the way down to form a long bottom wick (to a very specific limit) and then it recovered and the bulls took back control, pushing the price back up again. Another one with the same pattern (where the price was pushed to the same price level, and it then came back up), creates the ‘tweezer top’ shape. The bears were unable to push the price below the level seen in the tweezer bottoms. See the screen shot below. This happened twice in short succession before the price started trending in the upwards direction.

Japanese candlesticks – Tweezer Tops
The same is true for candles which appear in the same way, but reversed. These are called tweezer tops. See the example below where the price reached the same high in two candles next to each other before the price was pushed back down in a new trend/direction. As a minimum you would need two candles but there could be more which test the same level either with tweezer tops or bottoms.

We hope this explains this very useful candlestick pattern. Now that you are familiar with this pattern you will start to notice it when you are waiting for a reversal and when taken with other indicators/criteria, it could be a good entry point (or exit) depending on the direction of the trade.
We hope this helped! For more great tips and trading set ups visit our other blog pages at Trader Pro – Trading strategies for success in the financial markets (trader-pro.co.uk)
If you would like to use the charting software above, we highly recommend Trading View to you. Use the following link and you may receive a discount on your subscription: https://www.tradingview.com/?aff_id=117138&source=TraderProBlog
Please note any subscriptions taken via my affiliate link with Trading View may result in me earning a small commission. However, I provide complete transparency on me using Trading View personally – I publish my success on the financial markets via my broker reports and any profits earned were done so by using my own Trading View subscription, so I genuinely do recommend them and have been using the Trading View charts for many years.