Make money trading – some recent profitable trades for you!

Hi guys

Just wanted to share some recent profitable trades I placed in May… May was a very good month for me. I’m sorry this is a bit late! The first thing to note is the direction of the overall market in May… See below screen shot of the NASDAQ and the S&P 500 on the daily timeframes. They were both in a nice uptrend with the MACD opening up:

Markets overall – recent profitable trades

I like to get into trades when the markets overall are about to make a MACD cross over or that has just happened. The S&P 500 was a bit slower than the Nasdaq – you can see the cross over was a bit bumpy and happened mid month!

Now lets take a look at some trades I placed:

Seagate – recent profitable trades

This is an IT company. The trade I placed on this one was not for beginners – it’s not in a nice strong uptrend currently. However, I knew the price was in a habit of bumping against the EMA line at at the point I entered on 9th May, it had reached another low, and we had just had a MACD cross over. I set my target for the EMA line as I knew there would be some resistance there. Sure enough it reached it’s target by 15th May and was profitable.

GOOGLE – recent profitable trades

This one was in more of a typical trading pattern for my sytle of trading. It had started uptrending strongly after reaching overall lows. There was a support level at around the moving average cross overs and I entered at this point on 9th May, when the MACD was just about to cross. The price reached up out of a consolidation zone and hit it’s target on 11th May.

Easyjet

This was another one which was not in my typical trading pattern….. I don’t usually trade consolidations. You can see the price was moving sideways between quite a narrow channel. It made a MACD cross over at my entry point and I set my target for previous highs. This one was another profitable trade.

GOLD:

30m timeframe:

This trade was very typical of what I look for and it was profitable. I first checked the daily timeframe to make sure that the price was uptrending in the candles and the MACD. On the daily timeframe the price had just bounced away from a support level with a MACD cross over below the zero level of the histogram. Next I zoomed in and got in and out of the trade using the 30 minute timeframe above. I waited for a MACD cross over on the 30 minute timeframe and set my target for around the previous high.

For transparency I have copied below the relevant entries in my trading account.

Some recent profitable trades

Just to be clear, not all trades were profitable in May. I made a loss on Shell and a couple of other markets.

I hope you enjoyed this digest. Please check our other blog posts for helpful trading tips and resources: Trader Pro – Trading strategies for success in the financial markets (trader-pro.co.uk)

If you would like to use the charting software above, we highly recommend Trading View to you. Use the following link and you may receive a discount on your subscription: https://www.tradingview.com/?aff_id=117138&source=TraderProBlog

Please note any subscriptions taken via my affiliate link with Trading View may result in me earning a small commission.  However, I provide complete transparency on me using Trading View personally – I publish my success on the financial markets via my broker reports and any profits earned were done so by using my own Trading View subscription,  so I genuinely do recommend them and have been using the Trading View charts for many years.

Will the UK elections cause huge growth in the UK economy?

The question of whether or not the UK elections will cause the UK economy to grow, is an interesting one, and one which we consider below. We consider the impact of previous elections on the FTSE 100 index as well as the impact of Brexit. Let’s take a look!

The previous three UK elections and their impact

The followingUK elections took place previously:

  • 12 December 2019 – Conservatives
  • 8 June 2017 – Conservatives elected
  • 7 May 2015 – Conservatives elected
  • 2010 – Conservatives and Liberal Democrats elected under coalition
  • 1997 – 2010 – Labour was in power

OK… So now we know the history of who was elected previously, let’s compare this to the movements on the FTSE 100 index…:

UK elections

As you can see the first time the consercatives were elected in 2015, the economy did start to grow. This continued until around June 2018 when the economy started, what I refer to as ‘stagnating’. It was moving sideways from the highest peak, until the Covid issue for a period of nearly two years. Obviously Covid’s impact was to drop the share prices like a ton of bricks! There was a sharp recovery to a point from Covid up to the time we finally left the EU via Brexit. From this point onwards, the growth in the economy has outstripped any performance previously. It seems when we are being told that Brexit has had a terrible impact on the economy, we are in fact being lied to. (I do accept that businesses have got a lot more admin to deal with, but it seems notwithtstanding this, the economy bounced back from Covid and exceeded any of its previous achievements). The economy has now reached its highest highs ever recorded!

My trading view charts do not go back far enough to consider what happened when Labour were in power. However, I found the chart below on the following website: https://www.statista.com/statistics/261764/annual-development-of-the-ftsenull-index/

According to this chart, the value of the UK economy bounced around when Labour was in power. It seemed to have two peaks where the second did not outperform the first so it was not really growing.

What will the next UK election do to the value of our economy?

Considering it’s possible for Labour to come into power, we can probably expect the economy to start stagnating again. With either the Conservatives or Labour, it seems they were both against the Brexit vote, (they seemed to have spent more time trying to ‘undo the vote’ rather than implement it, and they were both on the same page on this. Given the Brexit vote seems to have had the most dramatic effect on our Economy in a good way and these two main parties were against it from the start, indeed they were arguing there would be absolute catastrophy as a result of Brexit, it’s very difficult to say what we can expect of them or how much, what they say, can be trusted!

The writer is unclear about what will happen but we do have the history there under each party as a slight indication of their performance. It seems however, that the UK citizens actually know better than both of them!

I hope you enjoyed this article.

For more great tips and advice on trading the stock market, please visit:

https://trader-pro.co.uk

To watch me trade live please visit my patreon page here:

https://www.patreon.com/Traderpro8320

Finally, if you would like to receive a discount on the Trading View charting software I use, please click on the relevant link here:

https://www.tradingview.com/?aff_id=117138

Make money trading – some recent profitable trades 22/07/2023

Lets take a look at some of the opportunities Trader Pro took advantage of. Below you will find the breakdown and thought process behind some recent profitable trades. Enjoy!

Natural Gas – 30m timeframe – recent profitable trades

Natural Gas is starting to creep up after much time of consolidation. See the daily timeframe chart below. Here’s what the chart looked like before I jumped into my trade:

Natural Gas - recent profitable trades

The trading timeframe I used was the 30 minute timeframe. You can see on the daily chart that the price hit a new high and then came back down to the 50 period EMA and started to find support. This is where I was looking to get in – with a profit target around the red resistance level noted on the chart above.

Now lets take a look at the 30 minute timeframe:

I entered the trade as per the trade diagram above. The MACD was just crossing over, the RSI had reached a low point, the price was trading above the 50 period EMA. Profit target for around the resistance level as noted with the red horizontal line on the chart (per daily timeframe).

Lets see what happened next:

As you can see, as predicted, the price rose to the resistance level and burst through it. It became overbought at that point and began to lose momentum. I had exited by this point.

As previously, I like to share the reports from my trading platform so that you know these are genuine trades which were placed by Trader Pro. Lets take a look at my exit per my trading reports:

I hope you enjoyed this blog post and that it helps goes some way to helping you understand multiple timeframe analysis and how to view the markets and identify opportunities taking all the different factors into account – timeframes, entry indicators, other useful information – how overbought or oversold a market is etc, where to set the profit target and stop loss.

Happy trading!

For more great tips and trading advice go to:

https://trader-pro.co.uk/

If you would like to use the charting software above, we highly recommend Trading View to you. Use the following link and you may receive a discount on your subscription: https://www.tradingview.com/?aff_id=117138&source=TraderProBlog

Please note any subscriptions taken via my affiliate link with Trading View may result in me earning a small commission.  However, I provide complete transparency on me using Trading View personally – I publish my success on the financial markets via my broker reports and any profits earned were done so by using my own Trading View subscription,  so I genuinely do recommend them and have been using the Trading View charts for many years.

How to make money trading! Trade set ups 19/09/2023

Hi guys

I wanted to share three different trade set ups with you – one which was a nice profit, another where the set up failed to progress in line with my intended entry plan and another where I am currently waiting to see if I should jump in… here goes!

Trade set ups – The profit maker: Natural Gas 19/09/2023

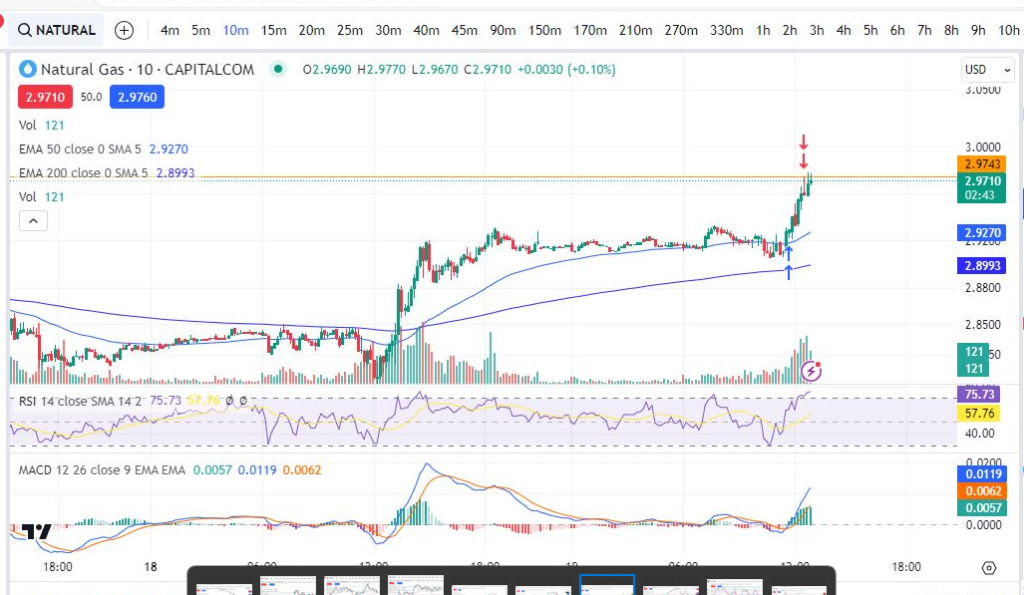
Here’s the daily chart screen shot – anyone familiar with my trading style will be aware that the daily time frame is the bible to me. You can see below that the market is slowly trending up… It was about to reach a ceiling in that it would soon touch / bump into the resistance lines on the daily timeframe – and potentially come back down. I made sure there was enough room to get a small trade in before it reached the orange line at around 2.9730:

Here it is again, this time on the ten minute timeframe:

You can see the markers with this timeframe of where I jumped in and out of the trade. My stop area would be below the moving average/lowest price most recently to the entry point.

The orange horizontal line is where I had marked exactly where the daily timeframe ceiling exists – so that I can see it on the smaller timeframes. By ceiling I am referring to the orange resistance line, mentioned above. Indeed you can see from how the trade played out, that the price did start to see resistance at that level.

Here’s a subsequent snapshot – you can see, as I predicted, the price fell back down from the orange line before going on to make new highs. This made a nice little profit. I’ve been trading the 10 minute timeframes most recently which i’ve started to enjoy. Some traders check the timeframes above the smaller ones like 1 hour, 4 hours etc but mostly I find I can make profit by just using the daily timeframe as my higher reference point.

Trade set ups – Silver 19/09/2023

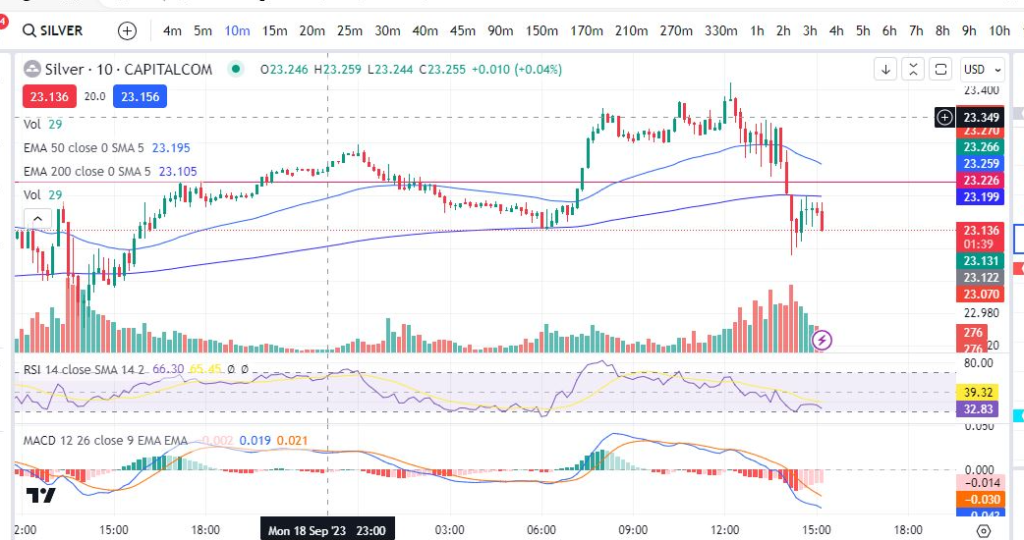
I’m sharing the daily and ten minute timeframes below again. On this one, I was waiting for the price to come down to the red horizontal line (at around 23.226), a major support area marked on the daily timeframe. Unfortunately, the price sailed straight down through this line so I abandoned my plan to jump in:

The trade set up which I was waiting on… ZZZZZZZZZZ ZZZZZ – Apple trade set up 19/09/2023

Here’s a trade set up I was waiting on:

The price looked like it was bouncing at a recent major support level on the daily timeframe – if the MACD cross over happened on the 10 minute timeframe, I wanted to jump in…

Trade set ups – Apple – how it played out!

OK… so this one was really interesting for a beginner trying to learn. I actually got in and out of this twice based on what was happening on the chart… let me explain!

In the above chart screen shot you can see I entered the trade. My intention was to get out at the previous high on the ten minute timeframe. Everything was looking ok at this point. Then this happened:

It started to make a little bump over on the four minute timeframe. The MACD had crossed to the downside. It could have just been a healthy pull back. However, with the miniscule and red candles being formed since entry, I felt nervous enough to jump out again!

After this the price started to recover and show signs of a strong push up/it was bouncing/finding support at the EMA line:

I jumped back in. You can see the two different entry points and my first exit above. NB: there are two arrows on each entry/exit because I run two different parallel versions of my trading concurrently – this is not important… I just don’t want beginners to become confused.

Finally, the price reached my original target at around the previous high on the ten minute timeframe… BOOM!

Trade set ups

A couple of takeaway points can be made from this trade set up and the way it played out:

  1. You should not be afraid to jump out of a trade if you feel uncomfortable with how it is unfolding – you can always get back in!
  2. Sometimes the markets do not behave immediately the way you would like them to – patience is key.

We hope this helped! For more great tips and trading set ups visit our other blog pages at Trader Pro – Trading strategies for success in the financial markets (trader-pro.co.uk)

If you would like to use the charting software above, we highly recommend Trading View to you. Use the following link and you may receive a discount on your subscription: https://www.tradingview.com/?aff_id=117138&source=TraderProBlog

Please note any subscriptions taken via my affiliate link with Trading View may result in me earning a small commission.  However, I provide complete transparency on me using Trading View personally – I publish my success on the financial markets via my broker reports and any profits earned were done so by using my own Trading View subscription,  so I genuinely do recommend them and have been using the Trading View charts for many years.

Some recent profitable trades – how to make money

Some recent profitable trades – how to make money

In this blog post I cover a couple of recent profitable trades placed. I will break down my entry and exit points. I hope you find this useful!

Seagate

Recent profitable trades

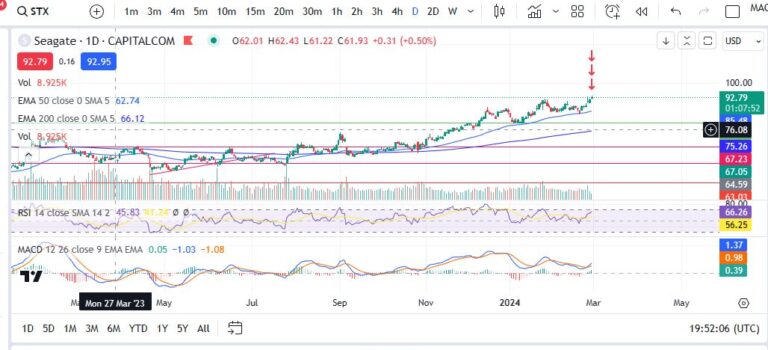
I first looked for an entry on the daily timeframe. The MACD had just made a cross over. The market was in an uptrend. The RSI was not too high. Next I checked the ten minute timeframe for an entry point:

Same thing again – looking for an entry on the MACD indicator where the MACD and signal are about to cross and ideally they are below the histogram. In this case They were low on the histogram but not quite below the zero line. The RSI had taken a dip. I set my target for the previous hight of the trend.

Recent profitable trades – Apple

Looking foran entry point, the MACDhad crossed over, was below the histogram zero level and the RSI was low. I then checked the 10m timeframe for an entry point:

The MACD had just made a cross over. Iset my target for a bit higher than the previous high. The RSI was low and the market had started to uptrend (above the 200 period EMA). Sure enough the trade reached its target!

Copper

Again, I checked that the MACD was in a good place on the daily timeframe. I also checked whether I would have enough room to reach a decent profit target before hitting the resistance level marked on the chart with the red line above.

Then I checked the ten minute timeframe for an entry point:

I set the profit target on this one for just below the red resistance level marked on the daily timeframe. I waited for a MACD cross over and the trade reached its target shortly after.

For more great tips and advice on trading the stock market, please visit:

https://trader-pro.co.uk

To watch me trade live please visit my patreon page here:

https://www.patreon.com/Traderpro8320

Finally, if you would like to receive a discount on the Trading View charting software I use, please click on the relevant link here:

https://www.tradingview.com/?aff_id=117138

Please note any subscriptions taken via my affiliate link with Trading View may result in me earning a small commission.  However, I provide complete transparency on me using Trading View personally – I publish my success on the financial markets via my broker reports and any profits earned were done so by using my own Trading View subscription,  so I genuinely do recommend them and have been using the Trading View charts for many years.