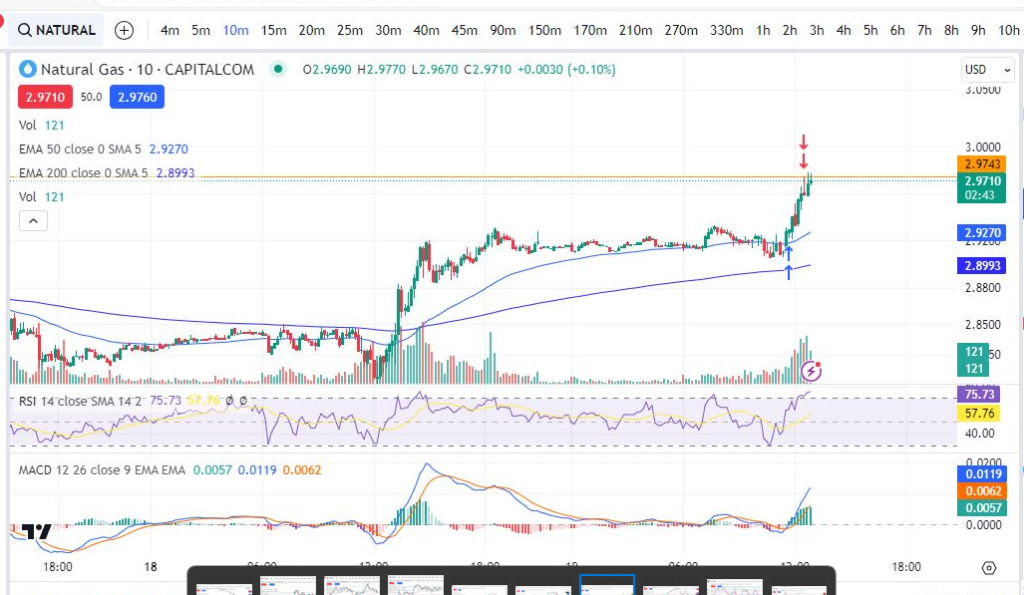
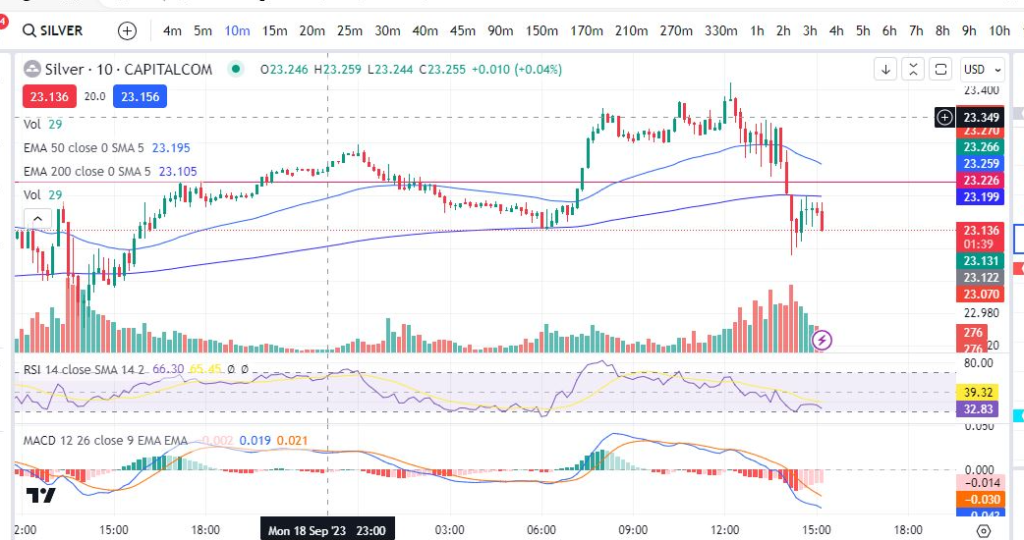
Another very useful candlestick pattern which any professional trader will be aware of, is the shooting star & hammer/hanging man. These are patterns which form from a single candlestick and can indicate that a reversal or new trend is about to start. We discuss these Japanese candlestick patterns below with some chart examples.
Japanese Candlestick Patterns – Shooting Star
Note that some knowledge of Japanese candlesticks is assumed on this page. Please see Japanese Candlesticks: An Introduction here, if you are new to Japanese Candlesticks: Japanese Candlesticks – an introduction – Trader Pro (trader-pro.co.uk)
The shooting star is formed by a single candle with a long upper wick and a very short or non existent lower wick. A picture of this type of candle is below.
The pattern is formed when there has been one last push/attempt by the bears to raise prices higher, but they failed and the closing price closed below, or very close, to the opening price.
Now let’s look at some examples on the charts:
You can see on this NASDAQ chart that the price was in a nice uptrend, until the shooting star appeared. Prices quickly descended from that point onwards.
How can you use the Japanese Candlestick pattern – Shooting Star in technical analysis?
If you are in a long position, waiting for prices to move higher and the shooting star candlestick pattern appears on the chart, it may, when taken with other indicators, indicate a good time to take profit off the table.
Japanese Candlestick Pattern – Hammer/Hanged Man
The Hammer/Hanged Man is the opposite of the shooting star. A picture of this type of candlestick pattern is below.
As in the case of the Shooting Star, the Hammer/Hanged Man candlestick pattern is formed when the sellers tried to push the price lower, but failed, and it closed very close to where it started. It can indicate a reversal of a downtrend/beginning of an uptrend.
Now lets take a look at some examples on the charts:
You can see in the NASDAQ chart above that the price reached a low point and then the hammer/hanged man formed. The bulls took control – the candle is green in this instance so price was pushed all the way down the lower wick but came all the way back up again and closed higher than the candle’s opening spot. Following this, the price reversed in a strong uptrend pattern.
How can you use the Hammer/Hanged man in technical analysis?
If you are looking for an entry point or are waiting for a reversal, this candlestick pattern, when taken with other indicators, could give you a good entry point.
We hope this was useful. You are likely to see a great deal of these candlestick patterns on the charts – we hope you are able to make good use of them in becoming more profitable.
We hope this helped! For more great tips and trading set ups visit our other blog pages at Trader Pro – Trading strategies for success in the financial markets (trader-pro.co.uk)
If you would like to use the charting software above, we highly recommend Trading View to you. Use the following link and you may receive a discount on your subscription: https://www.tradingview.com/?aff_id=117138&source=TraderProBlog
Please note any subscriptions taken via my
affiliate link with Trading View may result in me earning a small commission. However, I provide complete transparency on me using Trading View personally – I publish my success on the financial markets via my broker reports and any profits earned were done so by using my own Trading View subscription, so I genuinely do recommend them and have been using the Trading View charts for many years.


