Hi guys
I wanted to share three different trade set ups with you – one which was a nice profit, another where the set up failed to progress in line with my intended entry plan and another where I am currently waiting to see if I should jump in… here goes!
Trade set ups – The profit maker: Natural Gas 19/09/2023
Here’s the daily chart screen shot – anyone familiar with my trading style will be aware that the daily time frame is the bible to me. You can see below that the market is slowly trending up… It was about to reach a ceiling in that it would soon touch / bump into the resistance lines on the daily timeframe – and potentially come back down. I made sure there was enough room to get a small trade in before it reached the orange line at around 2.9730:
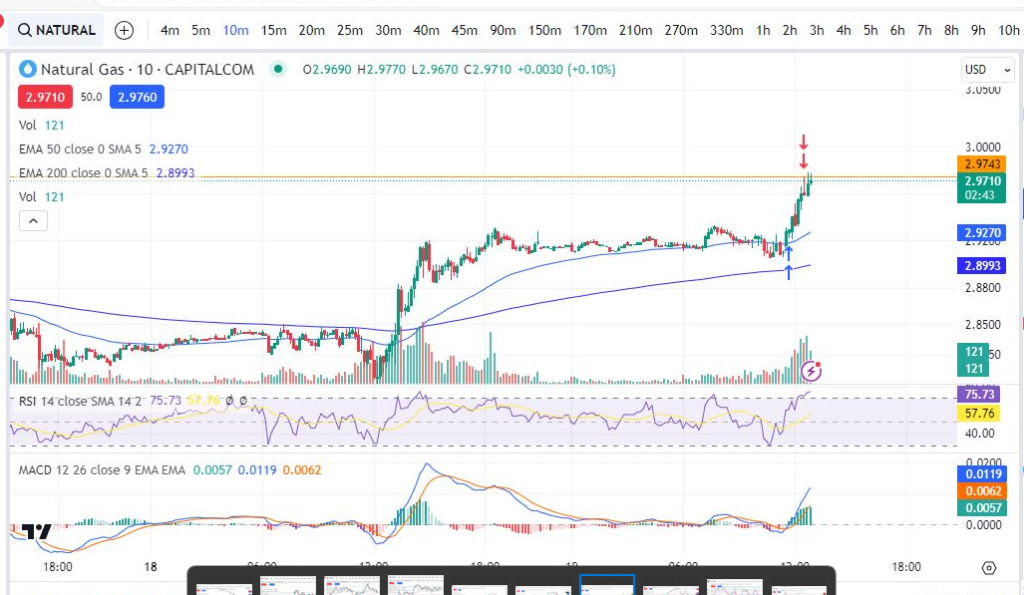
Here it is again, this time on the ten minute timeframe:
You can see the markers with this timeframe of where I jumped in and out of the trade. My stop area would be below the moving average/lowest price most recently to the entry point.
The orange horizontal line is where I had marked exactly where the daily timeframe ceiling exists – so that I can see it on the smaller timeframes. By ceiling I am referring to the orange resistance line, mentioned above. Indeed you can see from how the trade played out, that the price did start to see resistance at that level.
Here’s a subsequent snapshot – you can see, as I predicted, the price fell back down from the orange line before going on to make new highs. This made a nice little profit. I’ve been trading the 10 minute timeframes most recently which i’ve started to enjoy. Some traders check the timeframes above the smaller ones like 1 hour, 4 hours etc but mostly I find I can make profit by just using the daily timeframe as my higher reference point.
Trade set ups – Silver 19/09/2023
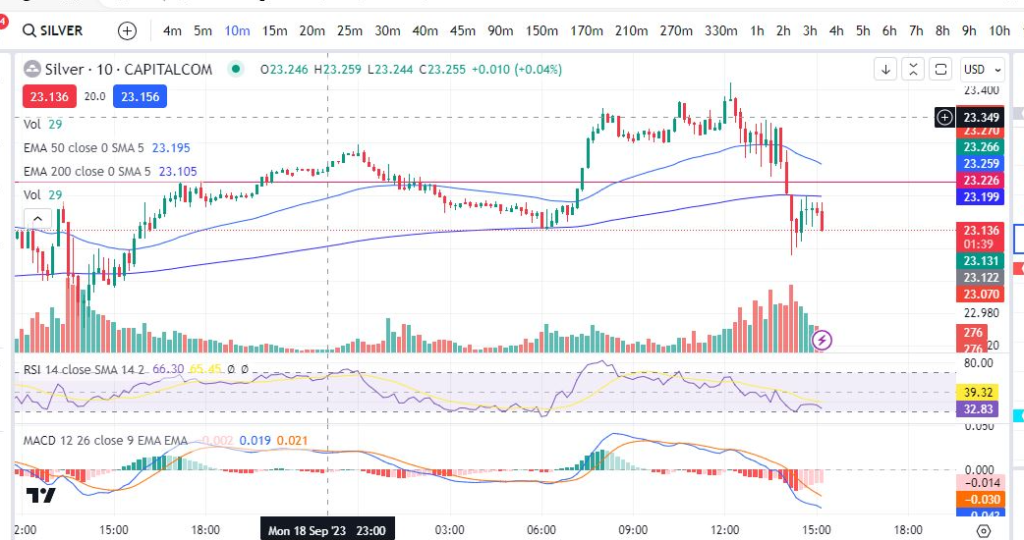
I’m sharing the daily and ten minute timeframes below again. On this one, I was waiting for the price to come down to the red horizontal line (at around 23.226), a major support area marked on the daily timeframe. Unfortunately, the price sailed straight down through this line so I abandoned my plan to jump in:
The trade set up which I was waiting on… ZZZZZZZZZZ ZZZZZ – Apple trade set up 19/09/2023
Here’s a trade set up I was waiting on:
The price looked like it was bouncing at a recent major support level on the daily timeframe – if the MACD cross over happened on the 10 minute timeframe, I wanted to jump in…
Trade set ups – Apple – how it played out!
OK… so this one was really interesting for a beginner trying to learn. I actually got in and out of this twice based on what was happening on the chart… let me explain!
In the above chart screen shot you can see I entered the trade. My intention was to get out at the previous high on the ten minute timeframe. Everything was looking ok at this point. Then this happened:
It started to make a little bump over on the four minute timeframe. The MACD had crossed to the downside. It could have just been a healthy pull back. However, with the miniscule and red candles being formed since entry, I felt nervous enough to jump out again!
After this the price started to recover and show signs of a strong push up/it was bouncing/finding support at the EMA line:
I jumped back in. You can see the two different entry points and my first exit above. NB: there are two arrows on each entry/exit because I run two different parallel versions of my trading concurrently – this is not important… I just don’t want beginners to become confused.
Finally, the price reached my original target at around the previous high on the ten minute timeframe… BOOM!
A couple of takeaway points can be made from this trade set up and the way it played out:
- You should not be afraid to jump out of a trade if you feel uncomfortable with how it is unfolding – you can always get back in!
- Sometimes the markets do not behave immediately the way you would like them to – patience is key.
We hope this helped! For more great tips and trading set ups visit our other blog pages at Trader Pro – Trading strategies for success in the financial markets (trader-pro.co.uk)
If you would like to use the charting software above, we highly recommend Trading View to you. Use the following link and you may receive a discount on your subscription: https://www.tradingview.com/?aff_id=117138&source=TraderProBlog
Please note any subscriptions taken via my affiliate link with Trading View may result in me earning a small commission. However, I provide complete transparency on me using Trading View personally – I publish my success on the financial markets via my broker reports and any profits earned were done so by using my own Trading View subscription, so I genuinely do recommend them and have been using the Trading View charts for many years.


